When Returns Go Poof: Modeling Venture Capital
Do valuations have to fall 80%?
A Few Interesting Quotes
A fund with 30 companies expects to lose everything three out of four times.
A 100 company fund has a roughly one in three chance of disaster.
To achieve normal return targets, valuations need to fall 85%.
More to follow…
Goals
Understand the structure of venture capital through a simple model.
Provide some intuition behind the statistics used to get to these conclusions.
Get you to interact with me and help build my reputation as a pseudonymous account. Email me, comment, or, best of all, subscribe for free (I will never spam you).
I. Building A Simple Venture Capital Model
We know from VC Twitter (and Pitchbook) that startups are highly skewed. Meaning most startups will be worth nothing, and some will be worth a ton. (In mathematical terms, we expect the median to be a lot smaller than the mean.)
We need surprisingly few assumptions to gain important intuition about venture capital:
A big exit is a long shot. Let’s assume this means a 1% chance.
A big exit should be big. Call this $1 billion.
We need a portfolio of companies. Let’s assume 100 companies, $1mm each.
An Intuitive Explanation of the Binomial Distribution
A startup’s outcomes are binary, like a coin. It can either succeed or fail.

Caption: Representation of a binary outcome (a coin flip)
However, if you put a bunch of coins together, you get more interesting characteristics.
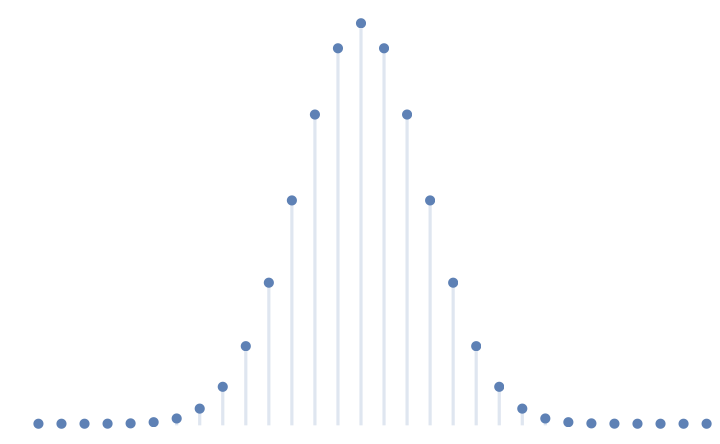
Caption: The probability distribution of a collection of binary outcomes (many coin flips)
The way you can model the distribution of outcomes of a portfolio of startups (and thus model the returns) of a venture capital fund is:
For every number of successes (0 company successes, 1 company success, 2 company successes…)
Multiply the number of scenarios through which that success can happen
By the probability of each scenario happening

Caption: Binomial Probability Mass Function
The first term (out of n, choose x) represents how many ways X successes can happen in N companies. For example, we want to know how many ways 1 success can happen in 100 companies, which is 100 (each company takes a turn succeeding). We’ll run this many times, increasing x to 1, 2, 3, etc.
The second and third terms represent the probability of each scenario. We have 100 companies. In this group of 100 companies, the probability of 1 succeeding implies 99 failing. So the probability of this scenario is P(Success) * P(99 Failures). Which in startup terms is: (1%)^1 * (1 - 1%)^99.
Applying the Binomial Distribution to VC
What does the probability distribution looks like for our VC fund?
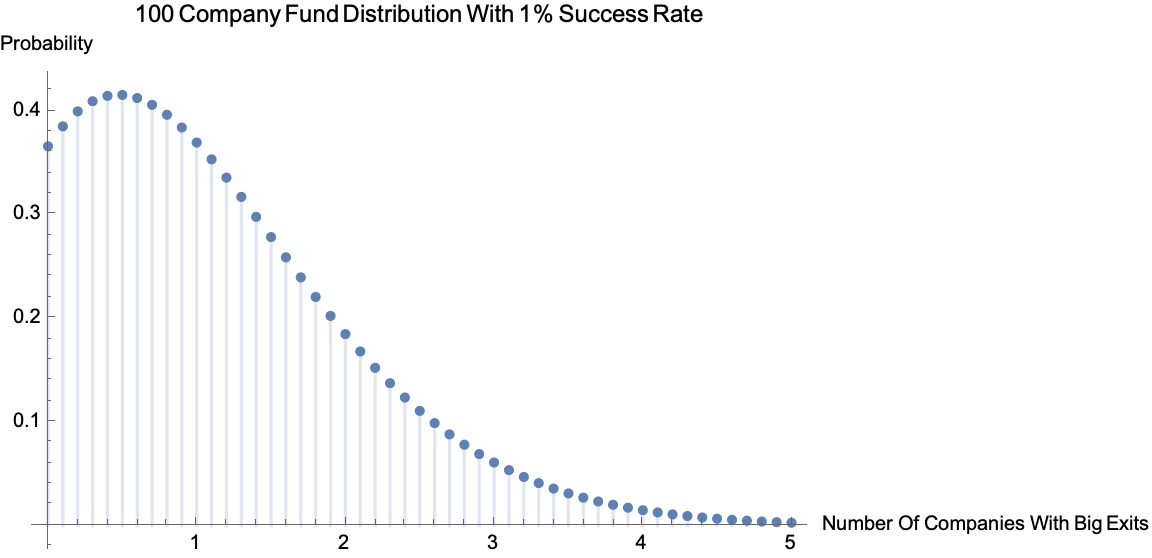
Caption: Probability Mass Function Given Previous Assumptions (N = 100, P = 0.01)
If we sum these probabilities up, we actually can see that there’s a significant probability this fund loses everything:
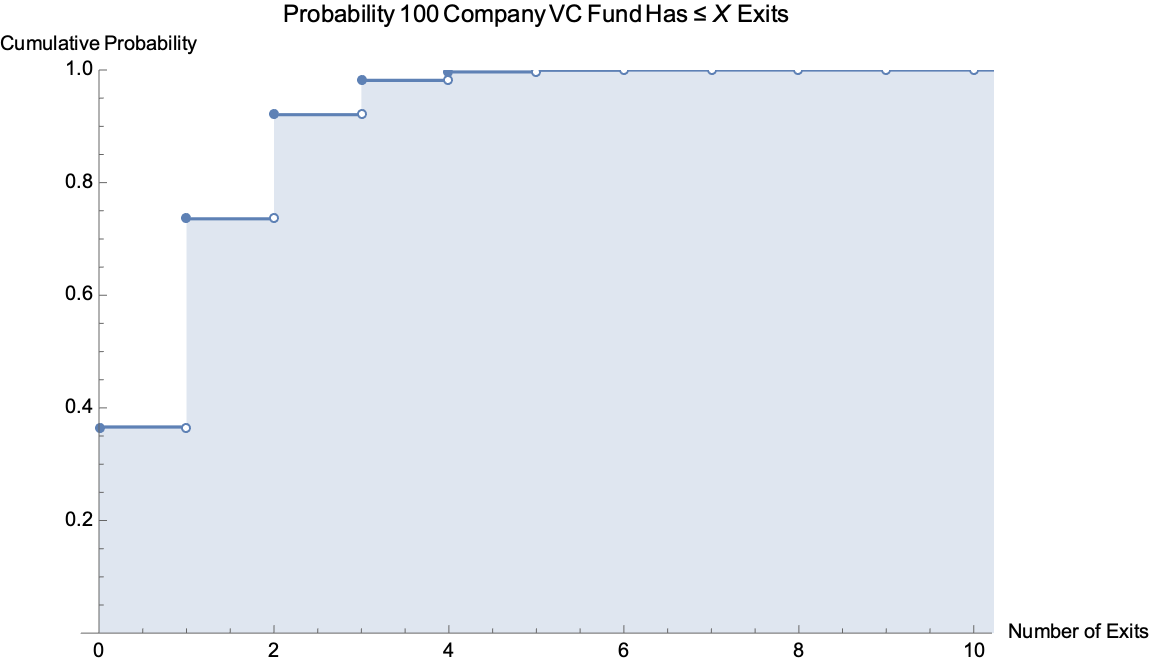
Caption: Cumulative Distribution Function Given Previous Assumptions (N = 100, P = 0.01)
A 100 company fund has a roughly one in three chance of disaster.
How could it be worse? A fund with 30 companies expects to lose everything three out of four times.
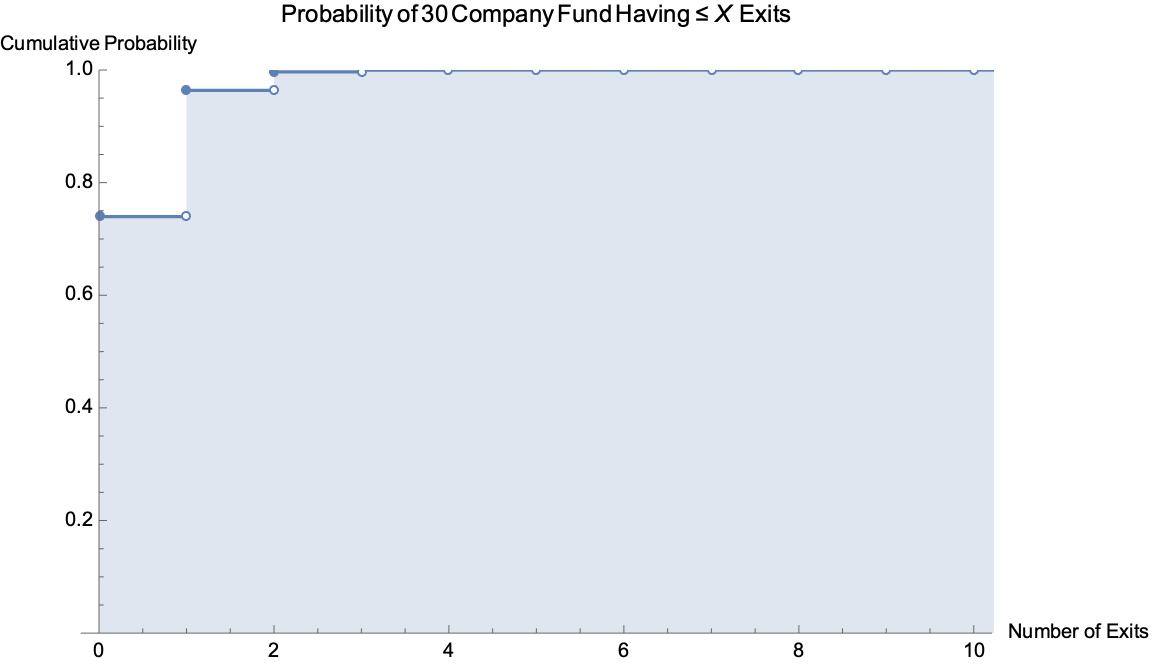
Caption: Cumulative Distribution Function Given Concentrated Assumptions (N = 30, P = 0.01)
The more companies we have in the fund, the less likely we are to lose all of our money.
For example: there’s only a ~15%, or 3 in 20, chance a 200 company fund gets ruined.
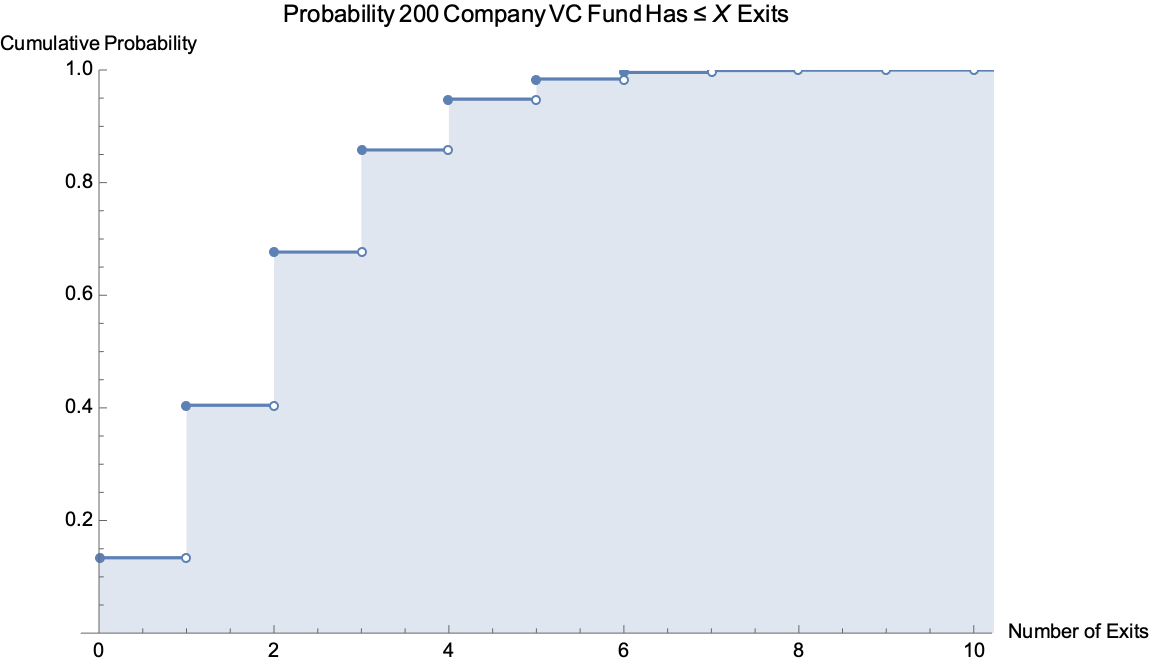
Caption: Cumulative Distribution Function Given Diversified Assumptions (N = 200, P = 0.01)
Variance works in favor of large funds. The “spread” of our distribution increases with the number of companies in this portfolio. This is good, because the distribution is bunched up close to zero, the variance will contribute almost all upside.
As we add companies to a fund, the binomial variance will shift probability mass from lower to higher numbers of exits.
II. Using Real Data
Our initial back of the envelope assumptions weren’t far off from what actually happens. We’ll use the NVCA-Pitchbook dataset (updated 1Q2020) to squeeze some real world intuition out of real world data.
Real World Impacts of Concentration
Real world funds suffer greatly from concentration.
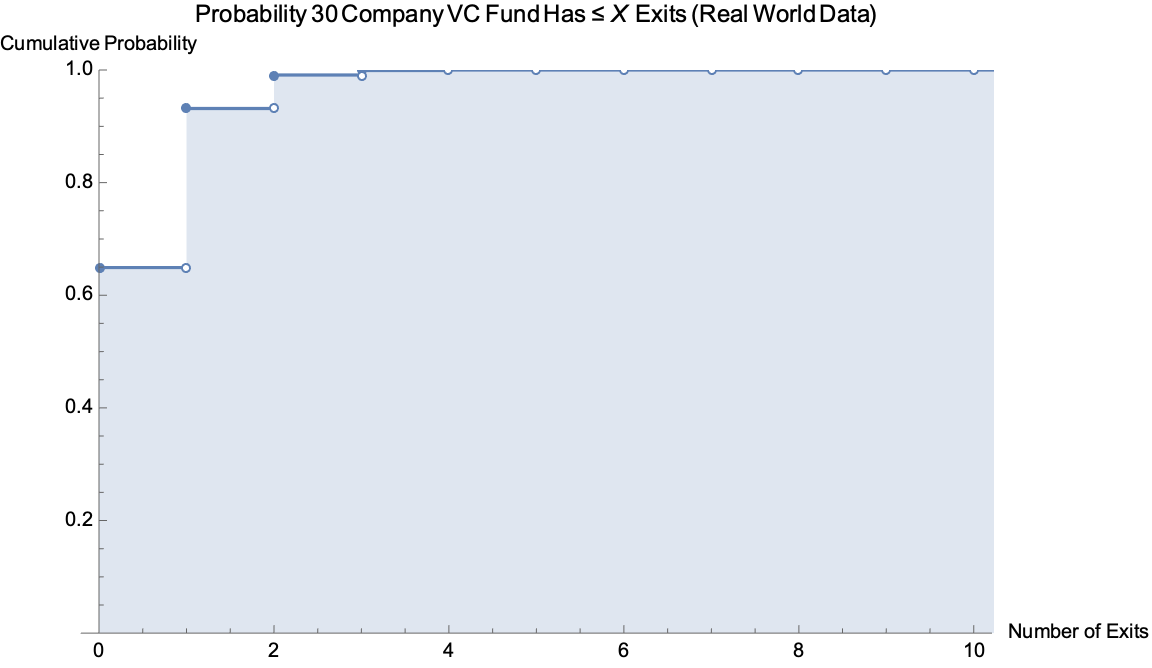
Caption: Cumulative Distribution Function Given Concentrated Real World Assumptions (N = 30, P = 0.0143)
We expect concentrated VC funds end up with nothing 2 out of 3 times. At the lower end of the probability of success range, p = .008, we can expect a concentrated fund to lose everything with 3 out of 4 times.
We can better understand the effect of fund size with the plot below. (Just a thought: if VC fund returns are power law distributed, could it be from the effect of size on fund variance, both in risk of ruin and in return space?)
You can see the binomial distribution at work: as the number of companies increase, peaks come forward, the curve “flattens”, and funds benefit from upside variance. In this metaphor, we want to be the purple downward triangles. (Mathematically, variance for a binomial distribution is equal to n*p*(1-p) and you can see the effects of increased variance as n increase.)
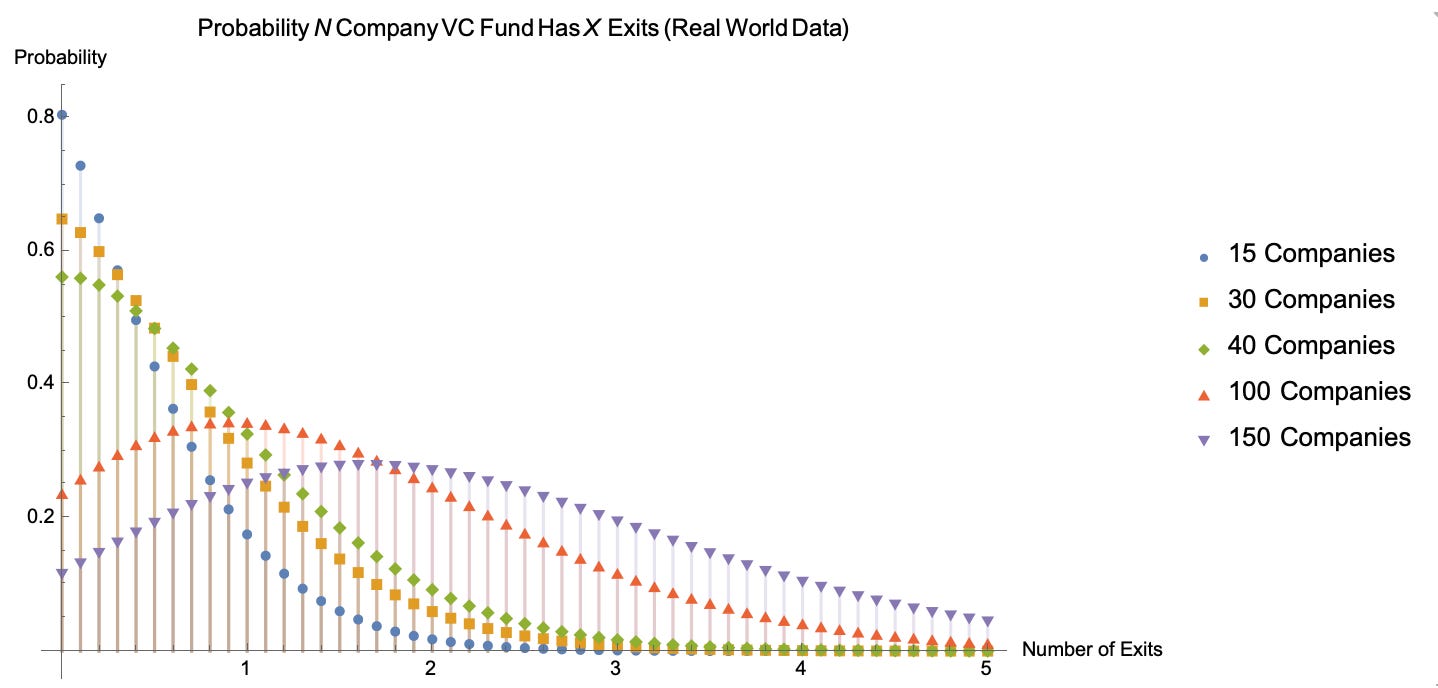
Caption: Series of Fund Distributions Given Real World Assumptions (N varies, P = 0.0143)
Okay. We’ve seen some pretty interesting real world implications about the composition of funds and learned some intuition about the binomial distribution.
But you can’t eat distributions. You can eat…
III. Returns
Using real world assumptions, what would you expect the return of venture capital to be with recent valuations? 10%? 15%? 20%?
The average compound annual return, net of fees, is expected to be -4.21%.

Caption: CAGR Given Real World Assumptions
Depending on how you do the calc, the average real world probability of IPO given that you raise venture capital will range between 80 bps and 175 bps. We were generous (again) and rounded up to assume the probability of great success as 2%.
Even using the highest exit valuation seen, venture capital return can’t clear a 5% benchmark, far from the traditional 20% expected annual returns.
Working Backwards
We can use our model to arrive at an estimated return given some assumptions, or we can use our model “backwards” to arrive at an assumption given an estimated return.
Let’s try uncover what recent valuations in venture capital implied about their expectations for the world:

Caption: Implied Exit Expectations Given Recent Valuations
Let’s run this model backwards for all the assumptions.
To hit 20% return targets, either:
Mean Exit Valuations have to jump to $11 billion, xor
Investors would have to own 72% of the company at exit, xor
The probability of major success would have to rise from a generous 2% to an extravagantly high 8.21%.
Something must give.
Brutal Valuation Implications
Venture capitalists don’t realistically have control over exit valuations, or owning 70%+ of the company, or supercharging probability of success.
What they do have control over is check size for a fixed equity percentage. Aka valuations.
The check size must fall from a recent $8mn to $1.21mn for the same equity percentage for the venture return picture to make any sense.
To achieve normal return targets, valuations need to fall 85%.
IV. Venture Capital Is Hard
It’s easy to look at this situation and conclude that venture capitalists are idiots. They are not. They are some of the smartest and most optimistic people in the world (shoutout @justGLew, @balajis, @naval, @pmarca, @peterthiel, @rabois, plenty more awesome ones).
Some of them are going to deliver 20% compounded returns. They are the best.
Everyone else is going to suffer tremendously.
Why did this happen?
We believe it is structural.
First, venture capital by definition must fight the brutal asymmetry of drawdowns. If your portfolio falls 50% in value, you need to somehow double your portfolio to get back to even, never mind make money. If most of your portfolio is designed to fall to 0%, the others have to do unbelievably well for you just to get back to even.
Second, in a low-yield environment, many investors are chasing an absolute threshold of returns instead of relative outperformance. To get that return, they’re venturing further out the risk curve, where VC lies.
Third, venture became the cool thing to do, people started venture firms who didn’t know what they were doing and didn’t know what the math looked like.
Fourth, I might be getting all of this wrong, in which case leave me a comment so I can learn from my mistakes.
V. Implications
Implications for Startup Founders
Future founders should expect lower valuations.
Are you doing this because you want to build a billion dollar business or because you want to build a business or because you want to solve a problem? Be clear about what you’re doing and why, because the reason VCs talk about billion dollar exits is that’s how their model becomes sustainable.
Implications for Startup Employees
Know what your estimate of the company’s probability of success (“POS”) is and what you’re trading for it. You are essentially “arbitraging” the implied POS. From a purely comp perspective, when you take the equity package as part of “below market” comp, you’re making a bet that your estimate of the company’s probability of success is greater than the venture implied POS. The VC is taking the other side of the bet. Are you smarter than them?
It should be greater by a large margin for a few reasons:
to compensate for risk (for example, VC implied POS is 80 bps, yours should be 5% or higher).
you’re not trading money for equity; you’re trading time for equity. Moreover, your time is not fungible. Your 20s will never come around again. Your 30s will never come around again. You can never get back your kids’ childhoods. You can never get back that time with your spouse.
asymmetry of knowledge. At the negotiation stage, you’ve done some research on the co, but you don’t have the due diligence or the access that the VCs had. You’re informationally at a disadvantage. So you take the VC’s word for it. By the time you can actually make a decision on POS, it’ll have been a year.
Mostly cash, some equity. Startup equity is like owning out of the money call options. If you don’t know what that means, think lottery tickets. Prefer a “barbell” approach: mostly in cash, some in equity.
Implications for Venture Capitalists
A “concentrated” venture portfolio is highly likely to go to zero.
Talk to me about modeling venture capital and what I’m doing right/wrong.
Lower valuations. By 80%.
Overall Conclusions
Geoff Lewis recently said there are some things you want to be first on, and some things you don’t. Being first to invest in the crisis at valuations anything close to previous valuations is probably not something you want to do.
All models are wrong, but some are useful. Models can help us understand the assumptions we’re walking around with and how likely they are to be true.
We’ve seen the binomial distribution in action today: a simple, yet powerful, model. We’ll look at some other ones in the future.
Join me in squeezing out intuition and insights from the real world.
VI. Sources
https://fundersclub.com/learn/guides/vc-101/understanding-venture-capital/
http://www.wsj.com/articles/andreessen-horowitzs-returns-trail-venture-capital-elite-1472722381
https://www.statista.com/statistics/828788/venture-capital-median-deal-size-by-stage/
http://www.angelblog.net/Venture_Capital_Funds_How_the_Math_Works.html
https://nvca.org/wp-content/uploads/2020/04/Q1_2020_PitchBook_NVCA_Venture_Monitor.pdf
https://news.crunchbase.com/news/inside-the-ups-and-downs-of-the-vc-j-curve/

